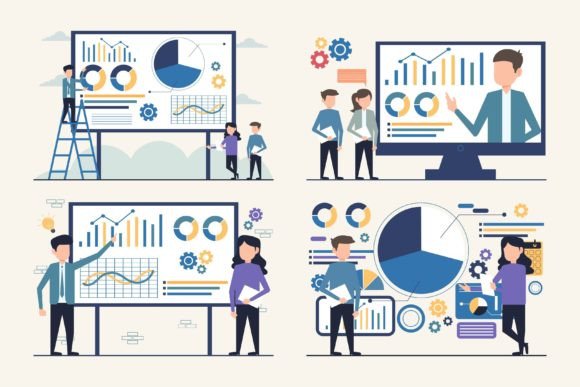
Mastering Business Analytics and Data Presentation: A Strategic Guide
In the modern corporate landscape, the ability to interpret complex datasets and translate them into actionable insights is no longer a luxury; it is a fundamental requirement for sustainable growth. Business Analytics and Data Presentation sits at the intersection of raw information and strategic decision-making. It involves the rigorous process of collecting, cleaning, and analyzing data to uncover patterns, followed by the critical task of visualizing that data in a way that stakeholders can quickly understand and act upon. While analytics provides the "what" and "why," data presentation delivers the "so what," bridging the gap between technical analysis and executive strategy.
The distinction between merely having data and effectively presenting it cannot be overstated. Many organizations possess vast repositories of information but struggle to derive value from them because the insights remain buried in spreadsheets or technical reports. Effective Business Analytics and Data Presentation transforms these abstract numbers into clear narratives. It requires a dual competency: the analytical rigor to ensure accuracy and the design sensibility to ensure clarity. When executed correctly, this discipline empowers leaders to identify market trends, optimize operational efficiency, and mitigate risks with confidence.
Understanding the Core Components and Distinctive Value
To evaluate whether your organization needs to invest more heavily in this area, it is essential to understand what makes Business Analytics and Data Presentation distinct from general reporting. Traditional reporting often focuses on historical performance, simply stating what happened in the past quarter. In contrast, modern business analytics is predictive and prescriptive. It uses statistical models and machine learning algorithms to forecast future outcomes and recommend specific actions.
However, even the most sophisticated predictive model fails if the results are not communicated effectively. This is where the "presentation" element becomes critical. It is not merely about creating colorful charts; it is about cognitive ergonomics. The human brain processes visuals significantly faster than text. Therefore, the goal of data presentation is to reduce cognitive load, allowing decision-makers to grasp complex relationships instantly. A well-designed dashboard or infographic can reveal outliers, correlations, and trends that would take hours to decipher in a tabular format.
One of the unique aspects of high-quality data presentation is its adaptability. In a dynamic business environment, a static report often becomes obsolete before it is printed. Modern approaches prioritize interactivity and scalability. For instance, a vector-based graphic asset used in a business presentation can be resized, recolored, or modified without losing quality. This flexibility ensures that the same core data visualization can serve multiple purposes, from a high-resolution print brochure to a mobile-friendly web banner, maintaining consistency across all communication channels.
Comparing Approaches: Static Reports vs. Dynamic Visuals
When evaluating tools and resources for your team, a common comparison arises between static PDF reports and dynamic, interactive data presentations. Static reports offer a snapshot in time. They are excellent for formal archiving, regulatory compliance, or situations where the data will not change frequently. However, they lack the agility required for real-time decision-making. If a stakeholder wants to drill down into a specific region or adjust a variable to see a different outcome, a static report cannot accommodate that request.
Conversely, dynamic Business Analytics and Data Presentation solutions allow for exploration. Interactive dashboards enable users to filter data, zoom in on anomalies, and toggle between different metrics. This approach fosters a culture of inquiry rather than passive consumption. The tradeoff, however, lies in the complexity of creation and maintenance. Building an interactive system requires more initial investment in software infrastructure and skilled personnel compared to generating a standard spreadsheet export.
Another alternative to consider is the use of pre-built templates versus custom development. Pre-built templates offer speed and cost-efficiency. They provide a standardized look and feel, which can be beneficial for internal consistency. Yet, they may not perfectly align with your specific brand identity or the unique nuances of your data structure. Custom development offers total control over every element, ensuring the visualization speaks directly to your audience's needs. The decision often depends on the frequency of use and the criticality of the message. For one-off projects, templates may suffice. For ongoing strategic initiatives, custom solutions often yield higher returns on investment.
Evaluating Tools, Formats, and Technical Requirements
Selecting the right format for your data presentation is a pivotal decision factor. The medium must match the message and the delivery channel. For digital platforms such as landing pages, mobile apps, or web graphics, scalability is paramount. This is where the choice of file format becomes a technical necessity rather than just an aesthetic preference. Raster images (like JPEGs or PNGs) are resolution-dependent; when scaled up, they become pixelated and blurry, undermining the professional quality of the presentation.
This limitation highlights the advantage of using vector graphics for Business Analytics and Data Presentation. Vector files, typically saved in formats like EPS or SVG, are mathematically defined. This means they can be transformed, scaled up or down, and manipulated without any loss of quality. Whether you need a small icon for a mobile notification or a massive hero image for a conference screen, the crispness remains intact. Furthermore, vector elements are easily editable. You can remove unnecessary components, add new text, or recolor elements to match evolving brand guidelines without needing to recreate the entire graphic from scratch.
Consider a scenario where a marketing team needs to repurpose a data-heavy infographic for a social media campaign. With raster images, they might have to recreate the chart at a lower resolution, risking legibility. With vector sources, they can isolate specific data points, resize the layout for Instagram stories, and adjust colors to fit the platform's aesthetic, all within minutes. This flexibility extends to various project types, including infographics, banners, and hero images, making vector-based assets a highly efficient resource for teams managing multi-channel campaigns.
While vector graphics excel in scalability and editability, they may not be the best choice for every situation. Photorealistic imagery, for example, requires raster formats. Additionally, some older systems or legacy software may not support advanced vector features. Therefore, a balanced approach often involves maintaining a library of high-resolution JPGs for immediate web deployment alongside the master EPS vector files for future editing. This hybrid strategy ensures both accessibility and long-term flexibility.
Strengths, Tradeoffs, and Decision Factors
Investing in robust Business Analytics and Data Presentation capabilities offers significant strengths. Primarily, it enhances credibility. Clear, professional visuals signal competence and attention to detail, building trust with investors, clients, and employees. It also accelerates decision-making cycles. When data is presented intuitively, meetings become more productive as teams spend less time decoding charts and more time discussing strategies.
However, there are tradeoffs to acknowledge. High-quality data visualization requires a blend of skills that are not always found in a single individual. It demands analytical expertise to ensure the data is accurate and design proficiency to ensure it is engaging. Organizations often face a shortage of talent who possess both skill sets. This can lead to bottlenecks where analysts produce accurate but ugly reports, or designers create beautiful but misleading visuals.
Another consideration is the cost of implementation. Developing a comprehensive suite of vector-based assets, perhaps comprising 100 source files in EPS formats along with high-resolution derivatives, represents a significant upfront investment. Teams must weigh this cost against the long-term benefits of reusability and brand consistency. If the assets are intended for short-term, low-impact use, the return on investment may be negligible. But for core business communications that will evolve over years, the initial effort pays dividends through reduced production time and consistent messaging.
Decision factors should also include the target audience. Executives often prefer high-level summaries with key metrics highlighted, while technical teams may require granular detail and raw data access. A one-size-fits-all approach rarely works. The ideal strategy involves creating a hierarchy of content: executive dashboards for leadership, detailed interactive reports for managers, and comprehensive data dumps for analysts. Each tier serves a specific purpose and requires a tailored presentation style.
When to Choose Professional Analytics Visualization
Determining when Business Analytics and Data Presentation is the right choice involves assessing the complexity of your data and the stakes of your decisions. If your organization relies on intuition rather than evidence, or if your current reporting leads to confusion and misalignment, investing in professional visualization is likely necessary. This is particularly true during periods of rapid growth, mergers, or market shifts where clarity is crucial for navigating uncertainty.
Furthermore, if your business operates across multiple channels—web, mobile, print, and presentations—the need for scalable, editable assets becomes urgent. The ability to transform a single set of data into various formats without quality degradation is a competitive advantage. It allows for agile marketing and communication strategies that can pivot quickly in response to new information.
On the other hand, if your data is simple, static, and intended for a very narrow internal audience, heavy investment in advanced visualization tools might be overkill. Simple spreadsheets or basic bar charts may suffice. The key is to avoid the trap of "over-engineering." Just as adding too many decorative elements to a graph can obscure the data, using overly complex tools for simple problems wastes resources.
Ultimately, the goal of Business Analytics and Data Presentation is to empower action. Whether you choose to build in-house capabilities, hire specialized agencies, or utilize flexible vector-based design resources, the focus must remain on clarity, accuracy, and usability. By carefully evaluating your needs, comparing available options, and understanding the tradeoffs, you can develop a data strategy that not only informs but inspires your organization to achieve its objectives.